88 words
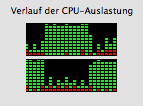
From time to time when I’m running Acivity Monitor in X.5 and the machine is busy on a single task that fully uses one of the system’s cores I notice that the load is shifted from one core to the other and back over time. I never saw that happen before X.5. And I have no idea why it is happening. It may be some mundane technical reasons. But I always like to think that the OS just wants to split up the work fairly between the cores…
April 24, 2008, 8:33
I’ve always found it interesting to watch the load shift from core to core (but then I find watching washing machines run interesting too - geek). Does a single threaded process get shifted from core to core depending on core temp / overall load / random jigglyness?
Oh, and I’m pretty sure this happened in X.4 - I remember using it to show off the fact that I had 2 processors in my Macbook (not a very scientific proof but hey).
April 24, 2008, 11:35
Awww… when you think about it, it actually kind of sweet! Maybe the other core would feel lonely and left out if he didn’t get to share in the work.
April 24, 2008, 11:48
@dan:
I never noticed this in X.4 and I tried spotting it after discovering it in X.5. That said, my eyes aren’t usually glued to these graphs.
@Dave2:
Yeah, I totally like the idea. No core gets left behind…
April 24, 2008, 11:58
It might do you well to learn how process schedulers work, Andrew Tanenbaum’s OS books are a great resource if you want to understand how they work in general. Amit Singh’s Mac OS X Internals covers the pre-Intel kernel in great depth, and it hasn’t soured a bit since the switch.
The unit on the x-axis of your graph is 1 second, and the y-axis units work out to more-or-less represent units of 100ms.
The OS X kernel’s scheduler cycles through the run-queue of processes at a rate of 100hz, for a quantum of 10ms:
# sysctl kern.clockrate
kern.clockrate: hz = 100, tick = 10000, profhz = 100, stathz = 100
So for starters your graph isn’t detailed enough to capture what’s going on, which I can take a fairly educated guess at:
Is the thread churning the CPU doing much IO to the network or the filesystem? If so, what’s happening when it ‘switches CPUs’ is that it’s blocking. It’s made a syscall to use a resource that is shared and slow, and it has to wait.
So the kernel schedules something else in the mean time using the rest of the blocked process’ quantum. When the blocked process’ resource is available, the kernel puts it back on the run-queue to be scheduled again, and it just so happens that when it’s turn comes up a different CPU is available.
The advantage of multi-core over multi-socket SMP (besides cost) is that the cores can easily share L2 cache (which the Intel Core CPUs do), so you don’t really get much of a performance hit from the scheduler switching CPUs on you this way.
There’s a concept of using configurable ‘Processor Affinity’ to pin threads to CPUs, but that’s only productive at all when the CPUs don’t share caches (on multi-socket systems). People only tend to use it at all on Windows — mostly due to it being exposed in the GUI, the tendency of adolescents of all ages to fiddle with things ignorantly seeking performance, and the sheer inadequacy of the Windows kernel.
April 24, 2008, 13:03


