GraphViz
717 words on Software
![]() GraphViz is an interesting visualisation tool. It lets you write a simple text file describing the nodes and the connections between them of a graph and then algorithmically creates the layout of the graph, apparently by trying to minimise the ‘forces’ between the objects. Depending on the content of your graph there are several different algorithms to choose from, ranging from
GraphViz is an interesting visualisation tool. It lets you write a simple text file describing the nodes and the connections between them of a graph and then algorithmically creates the layout of the graph, apparently by trying to minimise the ‘forces’ between the objects. Depending on the content of your graph there are several different algorithms to choose from, ranging from dot for tree-like graphs, neato and fdp for more force-based freestyle stuff and twopi or circo for more circular arrangements.
Thus, in theory, GraphViz is a fantastic tool to magically create meaningful graphs from simple relations between objects. Being open source and able to export into many file formats from bitmaps to PDF to SVG makes it also score high in buzzword bingo. There’s also a pretty abandoned looking, Design Award winning and not exactly easy to use graphical Mac application for the dot tool as well as a cool looking but presumably useless iPhone version for the same people.
There are, however, problems with GraphViz. One of them is documentation. As is par for the course for open source software, there is a formal specification for the language used and an alphabetical list of all the parameters you can use. Of course that’s pretty close to useless as it totally hides the fact that writing a dot file is quite easy. And once you figured that out, by looking at the pages of examples, it still remains frustrating to use the software because not all of the options work in all of the tools and generally the outcomes seem quite random in the sense that it often seems gratuitously hard to figure out or achieve simple graphical effects.
Particularly so, once you start creating slightly complex graphs. Positioning nodes ‘just right’ in those is pretty hard because the positions one node potentially affects all others. This makes it pretty much impossible to turn a graph which may represent the structure correctly into a graph that represents the structure correctly and looks good. Where ‘looking good’ also means that the graph can become clearer as a consequence of that because you have fewer crossing lines or the order of the nodes is more adequate for your current application. To a certain extent you can tinker with some of these aspects, but in my experience it quickly ends up being a lot of effort while still not giving the results I want.
In addition GraphViz, in true Unix style, is a one-shot-wonder - meaning that it simply processes the file you throw at it without any knowledge of previous runs. Hence even adding a single node to the graph can significantly change the layout the algorithm comes up with. This makes it pretty futile to try and ‘optimise’ the graph in any way unless you are 100% sure its nodes and edges will not change. It also keeps you from doing something like a development of the graph over time as adding a node will quite likely create a discrete jump in the graph rather than lead to a continuous change. As far as I understand the readmes of GraphViz, the way it optimises graphs actually is continuous in nature, so it’s likely that all the necessary algorithms are pretty much in place already and a shame that no interface to them is exposed.
Finally, there is the difficulty of the middle ground. Looking through the GraphViz examples page you will find mostly graphs which are small or structurally simple. Those tend to look all right. There are also a few examples which are very large and complex and in which the graph is seen as a global picture rather than revealing the details of its nodes. Of course the graphs I wanted to create are in the middle ground. They are too big and complex to fit in the first category but I am still interested in the detail information.
An example for many of these issues may be my UTI graph:
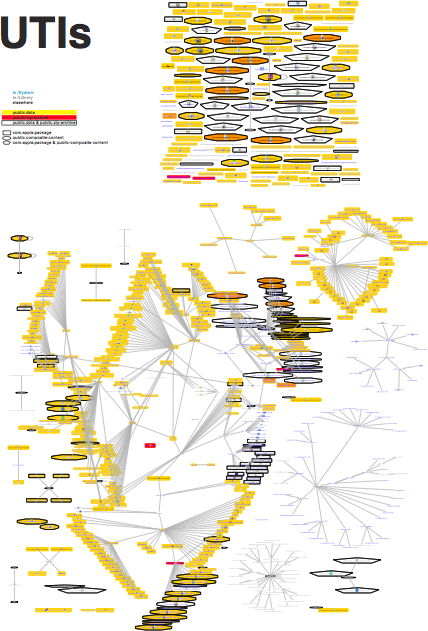
Once you start looking at it in detail to learn the exact information it contains, you will start noticing how the layout of the graph is far from perfect in many places. Improving on that seems quite hard. And getting everything ‘just right’ could very much end up being impossible.


