Zeitgeisty
1039 words
Inspired by Mike’s 2005 Zeitgeist, I got to play a bit with the various web analysis tools and want to list some results here. Let me note that I don’t particularly trust those tools as each of them gives different results, say for November 2005:
| requests | pages | bandwidth | |
| analog | 532652 | 42817 | ? |
| awstats | 373957 | 177690 | 5,03GB |
| webalizer | 766927 | 282976 | 7,05GB |
So I don’t trust those numbers too much. And I’m not sure how much they mean or what the term ‘pages’ is supposed to mean. Obviously there are different interpretations at work, as well as different skills at counting. Most of my images are hosted off-site, so I don’t know whether the ‘302’ requests are included in those numbers. In addition, I set up analog to ignore all traffic going to cgi-bin to avoid having all the comment spammers clutter the log analysis. But that’s ages ago and setting up analog was too painful to go through that and fix it ‘just for correctness’ again.
Unlike Mike, I can’t present consistent numbers for the whole year as we lived through a few generous cock-ups by our previous provider at the beginning of the year and Alf thankfully helped out hosting things for a while on his server. So the log-files we have aren’t exactly comprehensive at that time of the year. In what follows, I’ll try to pinpoint the mildly amusing things I could find in the statistics, rather than the big, meaningful ones.
To begin with a rather unsurprising point… the number of file requests rose throughout the year, giving a peak in November where a few popular posts came together:

But let’s move to more ‘relevant’ data, like the distribution of accesses throughout the week:
| Mon |    |
| Tue | |
| Wed |  |
| Thu | |
| Fri |  |
| Sat | |
| Sun | |
Great, we learned a great deal from that!
Next up, http codes. Those reflect a number of things. First, that I really like off-loading traffic to other servers using 302 redirects. Second, that I like to 403 block people who directly link to my images – more on those in a second – and; Third, that the 304 status code exists, possibly keeping people with aggregators or search engines from wasting my bandwidth. And, fourth, that there are numerous typos in URLs, or, more likely, attempts to access certain files which might make certain servers vulnerable, giving quite a few 404s:
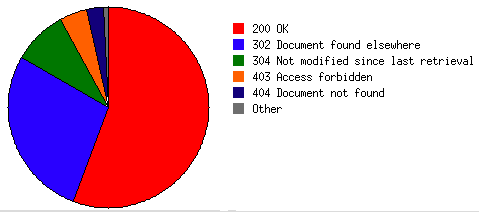
Other status codes we saw were 206, 500, 401, 405 and 416. If you know what the latter two mean without looking them up – erm – Congratulations!
The most popular files on the server are:
| requests | bandwidth | |
| index.rdf | 445K | 5,2GB |
| mt-comments.cgi | 336K | 1,2GB |
| qlc.css | 234K | 2,3GB |
qlc.gif  |
213K | 60MB |
| comments.js | 213K | 386MB |
qlc_grey.gif  |
203K | 31MB |
| qlc’s favicon.ico |
77K | 25MB |
| robots.txt | 52K | 20MB |
| 2003/06/referrers | 52K | 915MB |
| favicon.ico |
39K | 78MB |
| ssp/blog | 33K | 2,3GB |
So, let me summarise… the most popular files are auxiliary ones or those abused by comment spammers. Isn’t that great? But after a few more of those, there are finally the various earthlingsoft applications and blog posts I care about.
The most popular (or most accessed, at least) posts are
- Referrers (spam attractor)
- Make your own virus, the most commented-on post ever.
- Haldern Pop 2004
- iTunes Problems, which is pretty popular with Google and suggests the machine can’t tell current, relevant or helpful information from that which isn’t.
- Wir sind Helden – a short post from 2003 that’s surprisingly popular
- Weblog applications – comparison of aggregator-style Mac applications.
- Mellow Music – short blurbs on a number of albums.
- The Libertines – on their self-named sophomore album.
- Patrick Wolf – I like that one… good to see people are interested in his music.
- Wir sind Helden in English – a reader contributed translations to all Wir sind Helden lyrics, after finding the few translations I provided. As non-Germans start knowing the band, that’s quite helpful. The page has only been around since summer, so it’s not right at the top yet. And Google keeps spitting out my own older page first in its results.
- iBook RAM problem – quite popular for a short time spam.
- Gekommen um zu bleiben – more Wir sind Helden stuff.
- iTunes 4.9.
There’s nothing useful to report on referrer information. The bulk of people are referred by Google. Everybody else is dwarfed by their numbers. The most popular search terms were – unsurprisingly, for those who payed attention when I listed the popular pages above:
- how to make a virus
- quarter life crisis
- ballerburg
- itunes problems
- ipod generations
- patrick wolf
- wird sind helden
- gekommen um zu bleiben
- i wanna die
- redirectmatch
- religion sucks
- sigur ros
- itunes
- porn
I’m particularly proud of the last one in that list. But I think you have to use Google Germany to enjoy it.
The next topic to cover would be failed referrers. As I mentioned before, I set up the server to deny any request for images which have a referrer outside our site (and a selection of others). Basically I don’t want to host images for others and pay for their fun. The main culprits for wanting to use my bandwidth are at myspace.com (a site that’s apparently quite hip with the kids but which I didn’t even know about… getting old or so) and xanga.com.
The browser distribution I’m seeing is pretty similar to Mike’s results: Just over 40% IE, 16% Firefox, 15% Safari, 9% NetNewsWire and a number of smaller ones. Access by search engine spiders is excessive.
The most active commenters on these pages are the various vendors of erectile medicines and other drugs. Even with filtering hundreds, if not thousands, of their comments came through. Next up are probably me, d.w. and G. Other ‘known’ commenters who comment less regularly would be Dan, Sören or Scott.


